[Download Now] Champion Reversal Indicator ThinkorSwim TOS Script
[Download Now] Champion Reversal Indicator ThinkorSwim TOS Script
[Download Now] Champion Reversal Indicator ThinkorSwim TOS Script
Product Delivery: You will receive a download link via your order email immediately.
Should you have any question, do not hesitate to contact us: support@nextskillup.com
$47.00

![[Download Now] Champion Reversal Indicator ThinkorSwim TOS Script](https://nextskillup.com/wp-content/uploads/2022/05/Champion-Reversal-Indicator-ThinkorSwim-TOS-Script-1.jpg)

Secure Payments
Pay with the worlds payment methods.

Discount Available
Covers payment and purchase gifts.

100% Money-Back Guarantee

Need Help?
(484) 414-5835
Share Our Wines With Your Friends & Family
Description
 Champion Reversal Indicator ThinkorSwim TOS Script
Product description
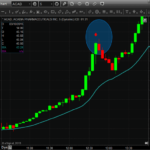
Champion Reversal Indicator
The Champion Reversal indicator can be used to identify potential reversals.
Champion Reversal Indicator
Ideal for mean reversion trading
I would like to know if the eSignal indicator can be done in TOS. The Arrow up/down must be triggered by the below criteria.
- I look for stocks hitting new highs or new lows
- I look for at least 5–10 consecutive 5min candles of the same color
- I look for RSI below 10 or above 90 to indicate extreme conditions
It would be great if the first 5 minute candle made a new high vs previous candle to change its color to yellow to alert me to buy or sell.
Let me know. Thanks!
It can be done.
I didn’t have access to the eSignal code for this indicator. The written description at the link posted by the requestor was used to reverse my Thinkscript.
The eSignal version.
The thinkorswim version.
This is an indicator. Potential. Check the following parameters for reversals.
- At least 5 same-colored candles in a row.
- RSI[5] is oversold (10) for bottom reversals or overbought (90) for top reversals.
- The reversal candle opens and closes outside of the bollinger bands.
The script settings panel has user-defined parameters.
Allow the reversal candle to be inside the bollinger bands if you want to be more aggressive.
Colored entry candles and initial stop levels were added.
I have written a script for the stock hacker Scan tool that will find stocks which are setting up for a potential reversal according to the criteria mentioned above.
The video shows how to set up the scans, how to run them, and how to save them to a watchlist. The scans were set up for searching 5 minute charts. A different aggregation period can be selected from the drop down list.
The video doesn’t have recorded audio.
Everything else is a technical analysis.
Learn how to understand technical analysis.
Technical analysis is an analysis method for forecasting the direction of prices through the study of past market data. It’s not like it’s like it’s like it’s like it’s like it’s like it’s like it’s like it’s like it’s like it’s like it’s like it’s like it’s like it Technical analysis and behavioral economics use the same tools. Being an aspect of active management is not in line with modern portfolio theory. It’s not like it’s like it’s like it’s like it’s like it’s like it’s like it’s like it’s like it’s like it’s like it’s like it’s like it’s like it The efficient-market hypothesis states that stock market prices are unpredictable, which is disputed by technical and fundamental analysis.
Readmore about : Champion Reversal Indicator ThinkorSwim TOS Script, reversal indicator thinkorswim tos script , champion reversal indicator, champion reversal indicator thinkorswim , reversal indicator thinkorswim tos
Delivery Method
– After your purchase, you’ll see a View your orders link which goes to the Downloads page. Here, you can download all the files associated with your order.
– Downloads are available once your payment is confirmed, we’ll also send you a download notification email separate from any transaction notification emails you receive from nextskillup.com.
– Since it is a digital copy, our suggestion is to download and save it to your hard drive. In case the link is broken for any reason, please contact us and we will resend the new download link.
– If you cannot find the download link, please don’t worry about that. We will update and notify you as soon as possible at 8:00 AM – 8:00 PM (UTC 8).
Thank You For Shopping With Us!
OUR BEST COLLECTION OF COURSES AND BOOKS

Reviews
There are no reviews yet.