[Download Now] Flux Trigger Pack – Back To The Future Trading
[Download Now] Flux Trigger Pack – Back To The Future Trading
[Download Now] Flux Trigger Pack – Back To The Future Trading
Product Delivery: You will receive a download link via your order email immediately
Should you have any question, do not hesitate to contact us: support@nextskillup.com
Original price was: $195.00.$40.00Current price is: $40.00.
79% Off

![[Download Now] Flux Trigger Pack – Back To The Future Trading](https://nextskillup.com/wp-content/uploads/2022/05/iiimg1733.png)

Secure Payments
Pay with the worlds payment methods.

Discount Available
Covers payment and purchase gifts.

100% Money-Back Guarantee

Need Help?
(484) 414-5835
Share Our Wines With Your Friends & Family
Description
[Download Now] Flux Trigger Pack – Back To The Future Trading
PLEASE REFER TO OUR PROOF : WATCH HERE!
- FLUX Volume Barrier
- FLUX Volume Vacuum
- FLUX Scalpel Signal
- FLUX Sentiment Zone Indicator
- FLUX Trend Membrane
- FLUX Hair Trigger
FLUX VOLUME BARRIER
The Volume Barrier takes the concepts of the Volume Vacuum, and incorporates a candle pattern into the calculation of the dotted line used to indicate critical accumulation and distribution areas along the DOM of the markets. The supply and demand zones are the areas of the market where institutions are prepared to move upwards or downwards. This Volume Barrier will create a signal when volume divergence is present, with a reaction candle exposing the supply or demand zone with a dotted horizontal line that can be used as an entry area, a stop area, or a re-entry area upon retest of the supply and demand zone.
The Volume Barrier can be seen across both non-time and time based chart bars. Our favorite setup so far involves Volume Barrier signals that are in line with the Trend Membrane, or what I call pocket signals, where the Volume reversal bar occurs in that soft rubbery band at a correction with trend. These signals are equally powerful as breakdown or break out indications in strong up trends and down trends on both the first break out, and then the re-test return to theAccumulation/distribution area that was tested for interest and exposed.

FLUX SCALPEL SIGNAL
They tell you that you are not supposed to have a favorite child. Every parent knows that there is one kid that gets to your heart quicker than the others. The Scalpel Signal is an indicator for us.
A leading Time/Price comparison with regards to market exuberance or depression is included in the framework of the Scalpel Signal. We conformed the code of the Flux Sentiment Zone around that framework, and were astounded by what we found. It’s not like it’s like it’s like it’s like it’s like it’s like it’s like it’s like it’s like it’s like it’s like it’s like it’s like it’s like it The Sentiment Zone tool’s time/price cycles were reliable. We were able to incorporate a sensitivity component into the parameters allowing users to see primary trend geneses/exhaustion’s or intermediate corrections and swing legs inside the overall trend. On 2 tick bars, this indicator can be used. This signal is a contender for the most powerful price action reversal indicator.
Get Flux Trigger Pack – Back To The Future Trading, Only Price 47$
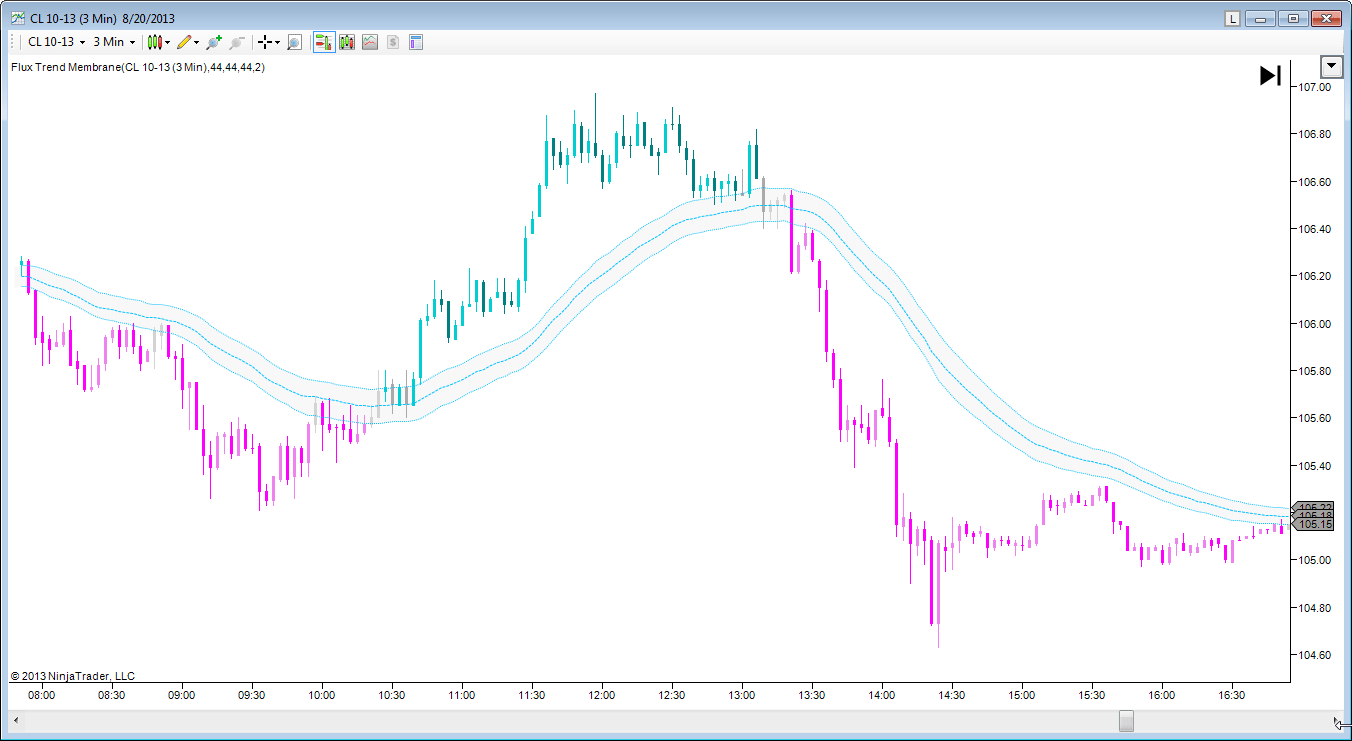
FLUX TREND MEMBRANE
This appears to be a very simple indicator, but it is very powerful when used correctly. It encourages traders to adopt a trend following setup and when used correctly will help keep traders out of choppy markets.
The first step in establishing what the dominant higher time frame trend is is to apply the indicator to an anchor time frame. Fresh pushes into that first A to B leg of the market when it corrects and launches when the color rotation from bearish to bullish is applied on the lower,trigger time frame.
The Barrier is seen as an area and not a line in the second method. The barrier average will be respected by many of the trigger trades, and they will settle into that area like a rubber band. This setup encourages traders to wait for a confluence between the pullback to the averages band and a signal from a secondary source. Having a band helps traders see an over-correction as opposed to a fake break out. It’s not like it’s like it’s like it’s like it’s like it’s like it’s like it’s like it’s like it’s like it’s like it’s like it’s like it’s like it The 3rd way is a brute force entry and exit.
The width acts as a stop allowing traders to analyze short term risk for possible trades that can become quick break even entries. A high probability reversal after each color rotation is what we have noticed when we break through the MA band. The few traders we have allowed to see this indicator before release have described being able to clearly see the stereotypical 3 movements, or the A-B-C patterns of the markets with the candles colored the way that we have programmed them, as well.
The data mined in the Time and Price areas of the Flux Basic, Professional, and Investor class tool set is perfectly complemented by the Flux Trigger Pack collection of confirmation, price action indicators. You will be combining two or more of these powerfully accurate signals and incorporating them into your own personalized trading plan.
Delivery Method
THE MOST ACCURATE PRICE ACTION CONFIRMATION TOOLS IN OUR FAMILY OF INDICATORS
Based on its Fluz Sentiment Zone roots and genealogy, we’re particularly encouraged by its use as a “buy” indicator…as it seems to find prices where people are willing to purchase and come into the market very well which is extremely useful in a bull market like this one.

– After your purchase, you’ll see a View your orders link which goes to the Downloads page. Here, you can download all the files associated with your order.
– Downloads are available once your payment is confirmed, we’ll also send you a download notification email separate from any transaction notification emails you receive from nextskillup.com.
– Since it is a digital copy, our suggestion is to download and save it to your hard drive. In case the link is broken for any reason, please contact us and we will resend the new download link.
– If you cannot find the download link, please don’t worry about that. We will update and notify you as soon as possible at 8:00 AM – 8:00 PM (UTC 8).
Thank You For Shopping With Us!
OUR BEST COLLECTION OF COURSES AND BOOKS

Reviews
There are no reviews yet.